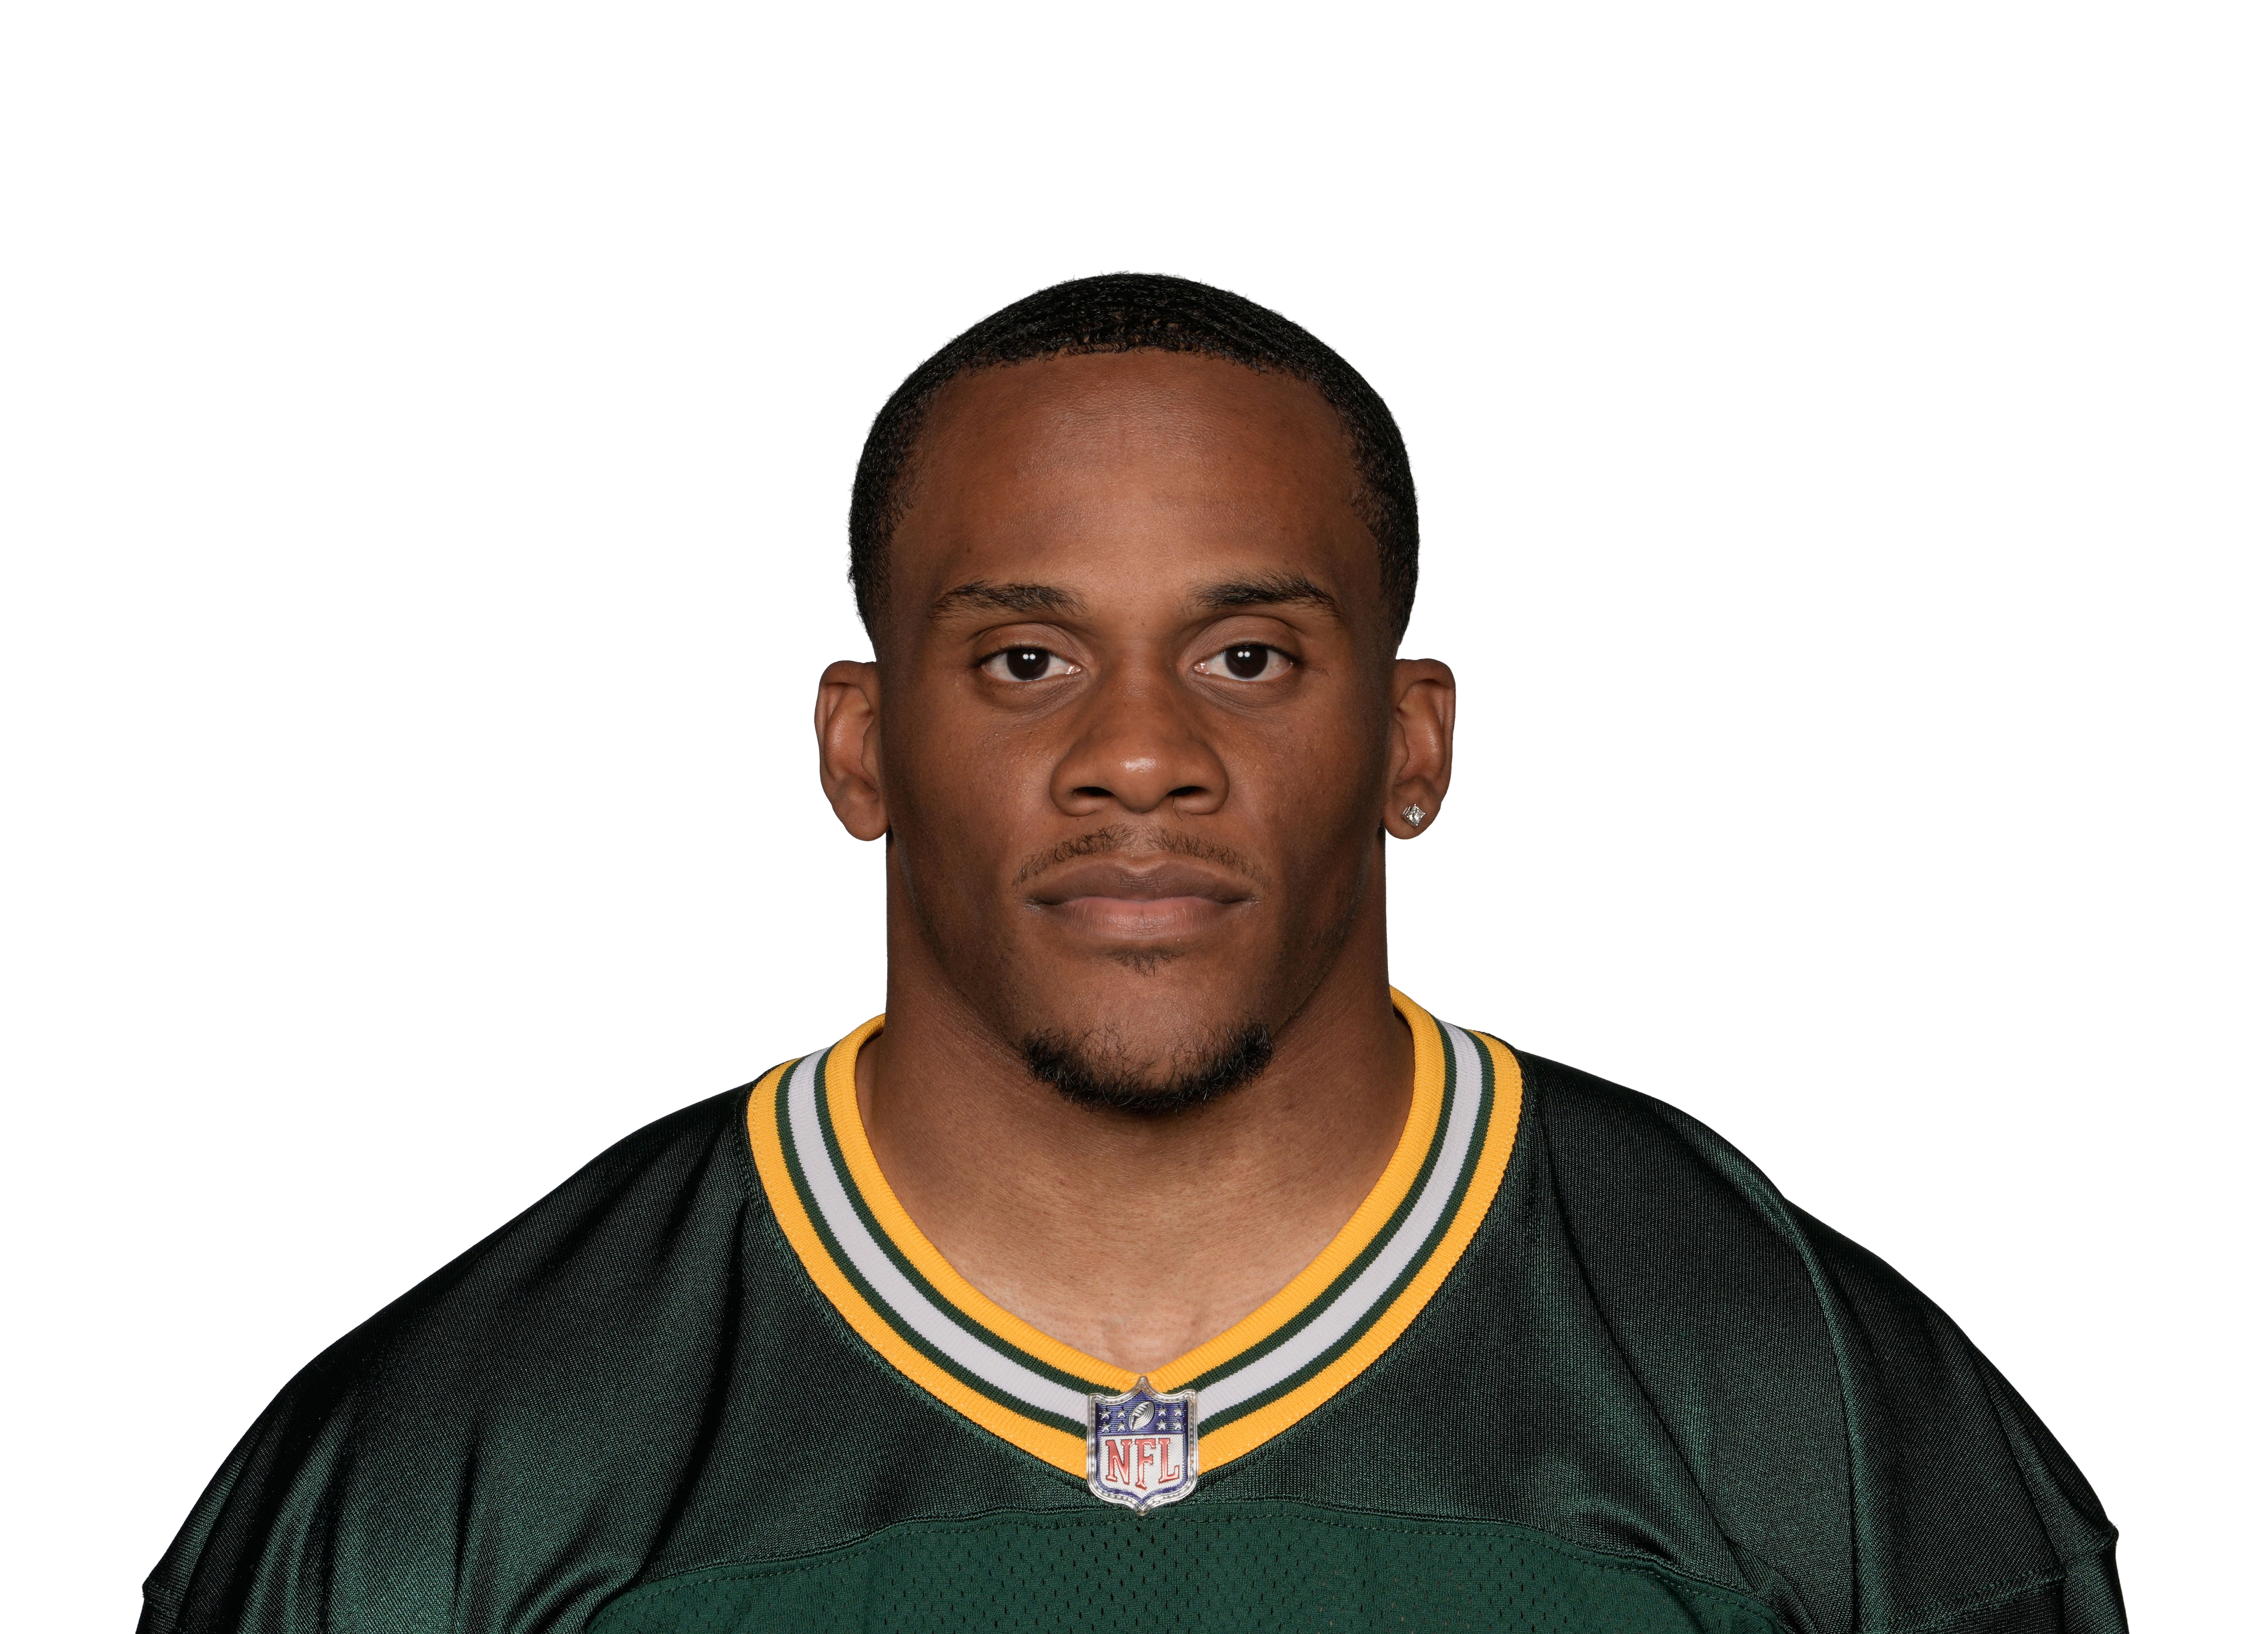
MarShawn Lloyd
GB · RB · #32 · USC; South Carolina · 3 yrs exp
Rising6 games · last played wk 6 · score +0.63
- Snap share
- 42%
- +3
- Targets / g
- 1.5
- −2.5
- Carries / g
- 9
- +3.5
- Opps / g
- 10.5
- +1
- Target share
- 4.5%
- −6.8
- Wk 1Wk 6Weekly: week 1 2.5, week 2 6.9, week 3 5.9, week 4 16.7, week 5 6.5, week 6 2.5
RZ targets / gLoading red zone usage
RZ carries / gLoading red zone usage
Goal-line opps / gLoading red zone usage
Why is the role changing?
Role trend: IncreasingSeeing fewer targets + Getting more carries.
- Seeing fewer targets
- Getting more carries
Based on his last 2 games vs. the 2 before.
Game log
| Week | Opp | Snaps | Snap % | Tgt | Tgt % | Rec | Rec yds | Car | Rush yds | RZ tgt | RZ car | GL opp | -10 tgt | Close tgt | TD | PPR |
|---|---|---|---|---|---|---|---|---|---|---|---|---|---|---|---|---|
| 6 | DAL | 30 | 40% | 1 | 2.5% | 0 | 0 | 8 | 10 | 0 | 1 | |||||
| 5 | CHI | 27 | 44% | 2 | 6.5% | 1 | 6 | 10 | 31 | 2 | 16.7 | |||||
| 4 | TB | 33 | 55% | 5 | 16.7% | 5 | 36 | 7 | 13 | 0 | 9.9 | |||||
| 3 | ATL | 15 | 23% | 3 | 5.9% | 2 | 7 | 4 | 11 | 0 | 3.8 | |||||
| 2 | NYJ | 16 | 27% | 2 | 6.9% | 2 | 6 | 6 | 20 | 1 | 8.6 | |||||
| 1 | MIN | 30 | 44% | 1 | 2.5% | 0 | 0 | 13 | 37 | 0 | 3.7 |
“—” means nflverse has no snap record for that game. Games with snaps but no stat line had zero passing, rushing and receiving stats. RZ = inside the opponent 20, GL = inside the 5, counted from nflverse play-by-play (regular season, excluding two-point tries). -10 = team down 10+ at the snap; Close = within 7 points either way. Loading red zone usage…
The shaded band marks the most recent 2 games used in the trend comparison.
Weekly snap share
Share of team offensive snaps (%)
Targets and carries
Volume per game
Production
PPR fantasy points and scrimmage yards
Opportunities
Targets + carries per game
Last 2 vs previous 2 games
Per-game averages · recent Wks 5, 6 · previous Wks 3, 4
| Metric | Previous | Last 2 | Change |
|---|---|---|---|
| Snap share | 39% | 42% | +3 |
| Offensive snaps | 24 | 28.5 | +4.5 |
| Targets | 4 | 1.5 | −2.5 |
| Target share | 11.3% | 4.5% | −6.8 |
| Receptions | 3.5 | 0.5 | −3 |
| Receiving yards | 21.5 | 3 | −18.5 |
| Carries | 5.5 | 9 | +3.5 |
| Rushing yards | 12 | 20.5 | +8.5 |
| Opportunities | 9.5 | 10.5 | +1 |
| PPR points | 6.9 | 8.9 | +2 |